Introduction
In this article, we demonstrate how to easily achieve identical setup - data visualization, with two different approaches - one using a JavaScript client side component and the other one using am ASP.NET server-side control. The sample uses chart components from ShieldUI, which are freely available from their site.
Often
times, when one is usign UI components, he is limited to one technology
or IDE. While this is not a problem in itself, there may be occasions
when flexibility is required. For example when a new developer or team
starts collaborating on a project, or the project requirements change.
Using a client side component, and its server-side counterpart is one
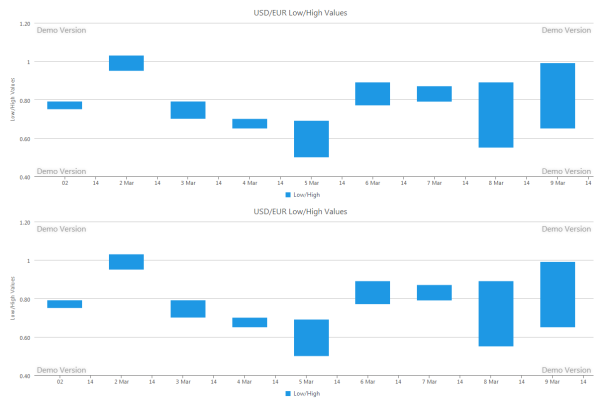
solution to the problem. The screenshot below demonstrates both controls
on the same page, with identical rendered layout:

Additionally,
both server and client/JavaScript components have their advantages and
disadvantages when coding. For example, the server-side ASP.NET component provides the comfort of working in Visual Studio, as opposed to directly coding in JavaScript.
Using the code
We start off by creating a new Visual Studio 2010 application. It will include the following required elements:
- An .aspx page, which will host both the client and server components
- the Shield.Web.UI DLL, which will be required in order to use the ASP.NET server-side component
- the .js files, necessary for the client side component
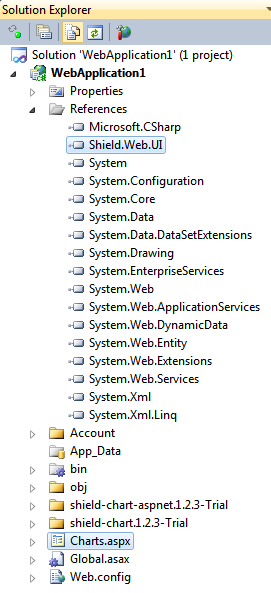
The structure of the project may look similar to this:

All required files are included in the working sample at the top of the article.
From
a coding perspective, the first task at hand is to include the scripts
and CSS files for the client side component, which we will be adding
first. This can be done in the head section of the .aspx page and looks
like this:
<head>
<meta charset=utf-8 />
<link rel="stylesheet" type="text/css" href="//www.shieldui.com/shared/components/latest/css/shieldui-all.min.css" />
<link id="gridcss" rel="stylesheet" type="text/css" href="//www.shieldui.com/shared/components/latest/css/light-mint/all.min.css" />
<script type="text/javascript" src="//www.shieldui.com/shared/components/latest/js/jquery-1.10.2.min.js"></script>
<script type="text/javascript" src="//www.shieldui.com/shared/components/latest/js/shieldui-all.min.js"></script>
</head>
The
next step is to add the JavaScript code, which will initialize the
component and render it to the page. This is done easily, and requires a
JavaScript tag and a div (which will host the actual chart) nested
within the page. This is demonstrated in the code sample below:
<div id="chart"></div>
    <script type="text/javascript">
        $(function () {
            $("#chart").shieldChart({
                exportOptions: {
                    image: false,
                    print: false
                },
                tooltipSettings: {
                    customPointText: 'Low Value: <b>{point.low}</b><br/>High Value:<b>{point.high}</b>'
                },
                axisY: {
                    title: {
                        text: "Low/High Values"
                    }
                },
                axisX: {
                    axisType: 'datetime'
                },
                primaryHeader: {
                    text: "USD/EUR Low/High Values"
                },
                dataSeries: [
                    {
                        seriesType: 'rangebar',
                        collectionAlias: 'Low/High ',
                        dataStart: Date.UTC(2010, 2, 1),
                        dataStep: 24 * 3600 * 1000,
                        data: [[0.75, 0.79], [0.95, 1.03], [0.70, 0.79], [0.65, 0.70], [0.5, 0.69],
                        [0.77, 0.89], [0.79, 0.87], [0.55, 0.89], [0.65, 0.99]]
                    }
                ]
            });
        });
</script>
The
code is pretty straightforward - it initializes the chart with numeric
range values on a datetime interval. All of the data passed to the
control is visible in the "dataseries" object. The next step in our
demonstration is to introduce the server-side chart. It will render
identical data and visualization. However, its code is much different.
For the ASP.NET chart, we start by adding a reference to the Shield.Web.UI DLL, and registering it on the .aspx page:
<%@ Register Assembly="Shield.Web.UI" Namespace="Shield.Web.UI" TagPrefix="shield" %>
Subsequent
to this, we need to enable certain settings for the control, in order
to have the same layout as in the client-side chart. This is
demonstrated in the code snippet below:
<shield:ShieldChart ID="ShieldChart1" runat="server" Width="100%" Height="400px"
        OnTakeDataSource="ShieldChart1_TakeDataSource" CssClass="chart">
    <PrimaryHeader Text="USD/EUR Low/High Values"></PrimaryHeader>
    <ExportOptions AllowExportToImage="false" AllowPrint="false" />
    <TooltipSettings CustomPointText="Low Value: <b>{point.low}</b>
      <br/>High Value:<b>{point.high}</b>"></TooltipSettings>
    <Axes>
         <shield:ChartAxisX AxisType="Datetime">
        </shield:ChartAxisX>
        <shield:ChartAxisY>
            <Title Text="Low/High Values"></Title>
        </shield:ChartAxisY>
    </Axes>
    <DataSeries>
        <shield:ChartRangeBarSeries CollectionAlias="Low/High"
            DataFieldLow="low" DataFieldHigh="high">
        </shield:ChartRangeBarSeries>
    </DataSeries>
</shield:ShieldChart>
The
only thing missing from the .aspx code above is the data for the
control. In the client side component, it was passed directly to the
component, in the script which created it. The ASP.NET
server component, however, is populated with data in a different
manner. This is done in the code-behind of our ASPX page. For this
purpose we use the "TakeDataSource" event handler. In addition to this,
in the
Page_Load event handler, we adjust the data start and end intervals. All of this is demonstrated in the snippet below:protected void Page_Load(object sender, EventArgs e)
{
(ShieldChart1.DataSeries[0] as Shield.Web.UI.ChartRangeBarSeries).DataStart = (decimal)(new DateTime(2010, 3, 1) -
new DateTime(1970, 1, 1).ToUniversalTime()).TotalMilliseconds;
(ShieldChart1.DataSeries[0] as Shield.Web.UI.ChartRangeBarSeries).DataStep = 24 * 3600 * 1000;
}
protected void ShieldChart1_TakeDataSource(object sender, ChartTakeDataSourceEventArgs e)
{
ShieldChart1.DataSource = new object[]
{
new { low = 0.75, high = 0.79 },
new { low = 0.95, high = 1.03 },
new { low = 0.70, high = 0.79 },
new { low = 0.65, high = 0.70 },
new { low = 0.5, high = 0.69 },
new { low = 0.77, high = 0.89 },
new { low = 0.79, high = 0.87 },
new { low = 0.55, high = 0.89 },
new { low = 0.65, high = 0.99 }
};
}
This
completes our setup. The two charts are rendered identically on the
page. Which way we use to handle our data visualization tasks is up to
us. Having flexibility, however, makes development easier.
Feel free to download the code and review it further.
Няма коментари:
Публикуване на коментар