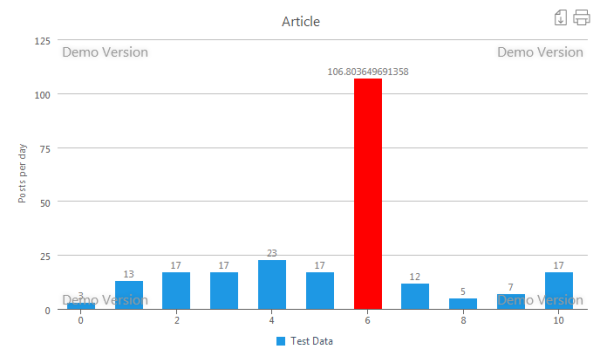
The finished sample will look like this:

In
numerical analysis, interpolation is a method of constructing new data
points within the range of a discrete set of known data points. Lagrange
interpolation can be used in two common scenarios. One is curve fitting
– given a set of points, on a plane, we want to fit a curve, which
passes through them. Another scenario is to find an intermediate point,
based on a set of data points. In this article, we will use the second
scenario.
The algorithm, which we will be using, is listed below:
private double getLagrangeValue(double x, double[] xcoords, double[] ycoords)
        {
            double sum = 0;
            for (int i = 0, n = xcoords.Length; i < n; i++)
            {
                if (x - xcoords [i] == 0)
                {
                    return ycoords [i];
                }
                double product = ycoords [i];
                for (int j = 0; j < n; j++)
                {
                    if ((i == j) || (xcoords [i] - xcoords [j] == 0))
                    {
                        continue;
                    }
                    product *= (x - xcoords [i]) / (xcoords [i] - xcoords [j]);
                }
                sum += product;
            }
            return sum;
        }
It
takes two sets of x and y coordinates, along with an x value for the
point which we will be calculating. It returns the y value for the point
that we are looking for.
Now that we have the algorithm for the polynomial interpolation, we can use it in a real data visualization scenario. For this purpose, I will be using the ShieldUI charting component for ASP.NET, freely available from their site.
To start off, I create a new Visual Studio 2010 solution, and add a simple web site to it. To take advantage of the charting component, we need to do two things:
Include the required scripts and resources, which is demonstrated in the code below:Now that we have the algorithm for the polynomial interpolation, we can use it in a real data visualization scenario. For this purpose, I will be using the ShieldUI charting component for ASP.NET, freely available from their site.
To start off, I create a new Visual Studio 2010 solution, and add a simple web site to it. To take advantage of the charting component, we need to do two things:
<head runat="server">
 <link rel="stylesheet" type="text/css" href="//www.shieldui.com/shared/components/latest/css/shieldui-all.min.css" />
 <script type="text/javascript" src="//www.shieldui.com/shared/components/latest/js/jquery-1.10.2.min.js"></script>
 <script type="text/javascript" src="//www.shieldui.com/shared/components/latest/js/shieldui-all.min.js"></script>
</head>
and also add a reference to the Shield.Web.UI dll in the .aspx page, which will be using it:
<%@ Register Assembly="Shield.Web.UI" Namespace="Shield.Web.UI" TagPrefix="shield" %>
Subsequent to this, we need to add the chart declaration in the .aspx page. This is done easily, as shown in the code below:
<shield:ShieldChart ID="ShieldChart1" Width="100%" Height="400px" runat="server"
OnTakeDataSource="ShieldChart1_TakeDataSource"
OnSeriesItemDataBound="ShieldChart1_SeriesItemDataBound"
       CssClass="chart">
        <PrimaryHeader Text="Article"></PrimaryHeader>
        <DataSeries>
            <shield:ChartBarSeries DataFieldY="YValue" CollectionAlias="Test Data">
                <Settings>
                    <DataPointText Enabled="true"></DataPointText>
                </Settings>
            </shield:ChartBarSeries>
        </DataSeries>
    </shield:ShieldChart>
We
have two tasks remaining. After we know which algorithm will be used to
handle the interpolation, we need to calculate the proper point, and
pass the data to the control to render. In addition to this, we need to
give the viewer a hint that one of the points is special.
Each data point in the control will be passed data by populating a small object of a class, which looks like this:
Each data point in the control will be passed data by populating a small object of a class, which looks like this:
public class ChartData
    {
        public bool isCalculated
        {
            get;
            set;
        }

        public int XValue
        {
            get;
            set;
        }

        public double YValue
        {
            get;
            set;
        }
    }
it
contains the standard x and y values, along with an isCalculated
property, which will be used to tell the control at runtime, that a
certain point needs to be colorized in a different color, to indicate
that this is the special point, derived from our algorithm.The data for the control is populated in the following method:
    public IEnumerable<ChartData> GetPosts()
        {
            List<ChartData> dataSource;

            double[] xcoords = { 1, 2, 3, 4, 5, 6, 8, 9, 10, 11 };
            double[] ycoords = { 3, 13, 17, 17, 23, 17, 12, 5, 7, 17 };

            ChartData calculatedItem = new ChartData();
            calculatedItem.XValue = 7;
            calculatedItem.isCalculated = true;
            calculatedItem.YValue = this.getLagrangeValue(calculatedItem.XValue, xcoords, ycoords);

            dataSource = new List<ChartData>()
            {
                new ChartData() { XValue = 1, YValue = 3, isCalculated = false },
                new ChartData() { XValue = 2, YValue = 13, isCalculated = false},
                new ChartData() { XValue = 3, YValue = 17, isCalculated = false},
                new ChartData() { XValue = 4, YValue = 17, isCalculated = false},
                new ChartData() { XValue = 5, YValue = 23, isCalculated = false},
                new ChartData() { XValue = 6, YValue = 17, isCalculated = false},
                calculatedItem,
                new ChartData() { XValue = 8, YValue = 12, isCalculated = false },
                new ChartData() { XValue = 9, YValue = 5, isCalculated = false},
                new ChartData() { XValue = 10, YValue = 7, isCalculated = false },
                new ChartData() { XValue = 11, YValue = 17, isCalculated = false }
            };

            return dataSource;
        }
This method contains the xcoords and ycoords arrays,
which will be passed to the routine calculating the Lagrange value,
along with the index of the point. All the required data is incorporated
into a new ChartData object, which is the special calculated point.
This, along with the other data, forms a List of object to be passed to
the chart. The only logic which remains to be handled is to tell the chart component, to colorize one of the items. This can be done “SeriesItemDataBound” event handler:
protected void ShieldChart1_SeriesItemDataBound(object sender, ChartSeriesItemDataBoundEventArgs e)
        {
            ChartSeriesItem item = e.Item as ChartSeriesItem;
            if (item != null)
            {
                ChartData ps = item.DataItem as ChartData;
                if (ps.isCalculated)
                {
                    item.Color = Color.Red;
                }
            }
        }
<span style="font-size: 9.5pt; line-height: 115%; font-family: Consolas;
background: none repeat scroll 0% 0% yellow;"></span>
This completes our setup. The complete working application is available for download and review here.
Няма коментари:
Публикуване на коментар