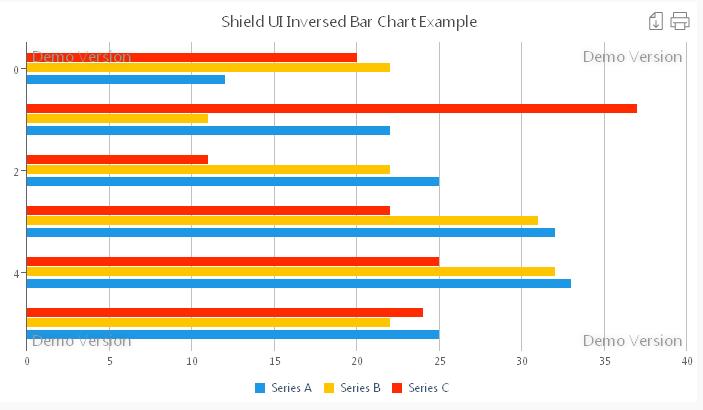
There is one property that needs to be set as shown below in order to have our Bar Chart inversed:
isInverted: true,By default this property is set to false and we have classical vertical bars. Similarly the Shield UI Inversed Bar Chart may contain one or more series of data represented by bars of identical colors. Each of the series is set up in code in a manner to the following code:
dataSeries: [{
seriesType: "bar",
collectionAlias: "Total Visits",
data: [12, 11, 23]
}, {
seriesType: "bar",
collectionAlias: "Unique Visits",
data: [12, 11, 23]
}]
There are no additional settings for the Inversed Bar Chart data series. The Inversed Shield UI Bar Chart has the same useful features like the normal Bar Chart. We again may preselect a bar from the data series code as shown below:
data: [12, { y: 11, selected: true }, 23]
Each of the data series bars may be selected or we may prevent them from doing so by using the enablePointSelection property:
seriesSettings: {
    bar: {
        enablePointSelection: true
    }
}
The grouping of data series values is also possible for the Inversed Shield UI Bar Chart and so is stacking- showing the cumulative values for each data series point. Here again there are two options users can choose from. We may stack values by adding them, retaining the differences of the bars as shown on the image
below:
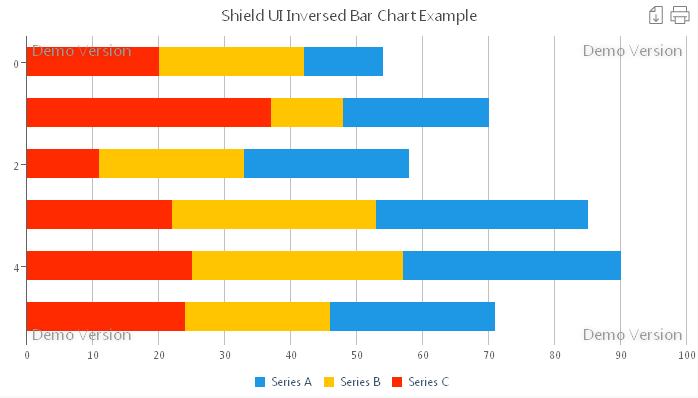
In order to do so we use the stackMode property as shown:
seriesSettings: {
bar: {
stackMode: "normal"
}
},
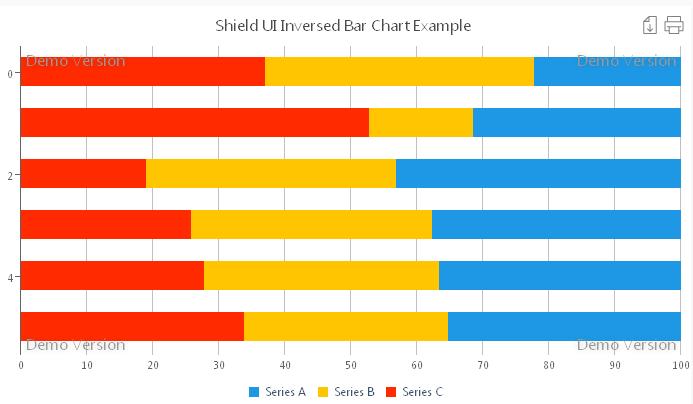
Percent stacking is also available for the Inversed Bar Chart. The visual effect is quite similar to the normal Bar Chart. In order to use percent stacking we use the following code:
seriesSettings: {
bar: {
stackMode: "normal"
}
},
The resulting chart is shown on the next image:
The Inversed Shield UI Bar Chart doesn’t differ in features. It allows easy binding to remote or local data, zooming, exporting or printing.
A live editable example for the Inversed Shield UI Bar Chart can be found here: Live Example
Additional resources and code samples for the Inversed Bar Chart can be found here: Documentation
Няма коментари:
Публикуване на коментар