
We may add labels showing each points values by enabling the dataPointText property as shown in the code sample below:
        dataPointText: {
         enabled: true,
         borderRadius: 4,
         borderWidth: 2,
         borderColor: "red"
        }
Having done so, we get the following result:

There are two labels per point showing the low and high range values. For more complex data series, or just as when needed we may enable zoom for the Shield UI Range Area chart. For that purpose we use the following code:
zoomMode:'xy',
The chart can be easily bound to remote or local data. As shown in the online example we take use of local data binding, by declaring an array and filling it up with the values we are going to visualize:
var LocalData = [
[0.75, 0.79],
…
  ];
];
We may use one or more variables- depending on the number of data series we are going to use. When done, we simply pass the array data to the chart’s data property:
 seriesType: "rangearea",
      collectionAlias: "Series A",
      data: LocalData
In addition we may apply some styles to the legend by centering it on the top and putting a red rounded corners box around it. We make that using the following piece of code:
    chartLegend: {
      align: "center",
      borderRadius: 2,
      borderWidth: 2,
      verticalAlign: "top",
      borderColor: "red"
    },
On the image below we can see the result of styling the legend: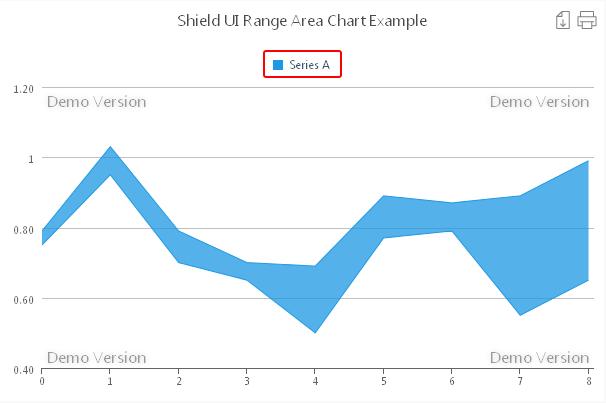
The range area chart also supports export to an image file or printing of the chart by a single click on the export or print buttons.
A live example for the Shield UI Range Area Chart that you can try yourself can be found here: Live Example
More information as well as extensive code samples for the Range Area chart type can be found here: Documentation and examples
Няма коментари:
Публикуване на коментар